BLOG
A Beginner’s Guide to Anomaly Detection


The possible use cases for IoT solutions are unlimited. So, the question becomes: how can a company leverage IoT technology to add value to consumer or business devices? Anomaly detection is one of the fastest ways to realize value.
One hallmark of a viable Internet of Things (IoT) product is a data science approach that does more than just correlate data – it transforms it into actionable data. Advanced analytics, artificial intelligence, and machine learning (ML) perform that function, and anomaly detection is often a natural place to start.
Anomaly Detection Defined
Anomaly detection is “the process of finding data objects with behaviors that are very different from expectations. Such objects are called outliers or anomalies.”
Essentially, we use data analytics, AI, and ML to identify observations that break the norm. They either exceed or lag behind the usual behaviors. These aberrations can have a negative quality, such as a device that’s not working properly, or they can be positive, like a mobile application seeing a sharp uptick in usage during a certain period. So, how does this benefit businesses?
The Business Value of Anomaly Detection
Anomaly detection brings benefits from both a business and technical standpoint. Organizations can use this analysis to inform strategic decision-making, such as devoting more budget to a project because its value exceeds expectations, or they can optimize an IoT device’s functionality with applications like predictive maintenance, where anomalous sensor data indicates expected machine failure so that we can fix it before it breaks – ultimately reducing or avoiding downtime. Other applications include determining consumer usage patterns, creating new products, and much more.
The Four Basic Types of Anomaly Detection
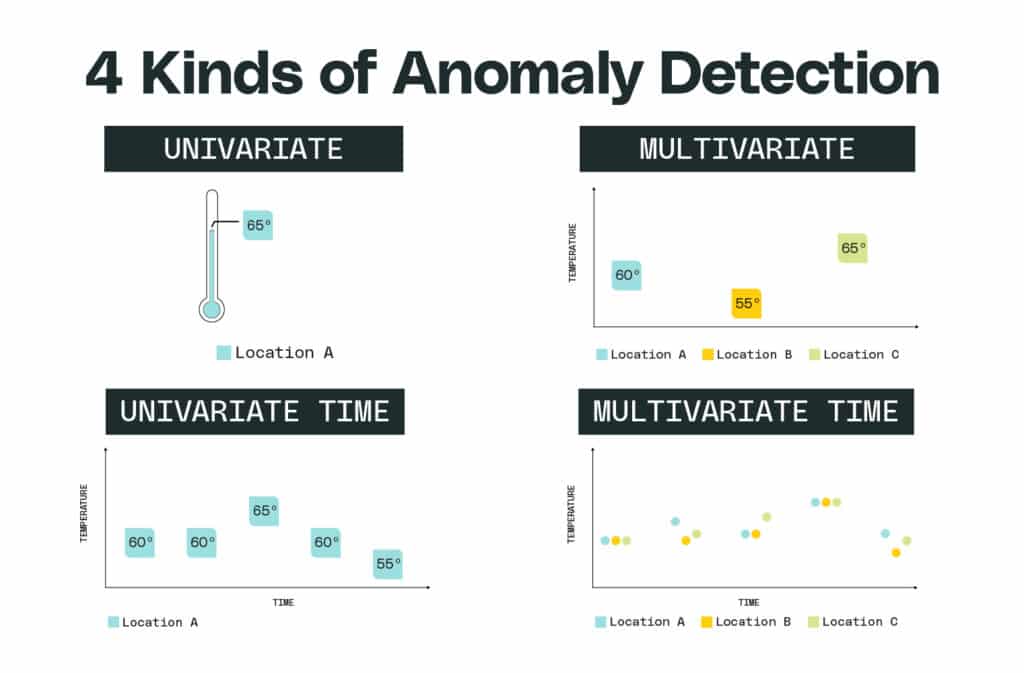
Scientists can choose from four basic types of anomaly detection, which we’ll cover in this article: univariate, univariate time series, multivariate, and multivariate time series.

Univariate vs Multivariate Analysis
The first question we ask when deciding what type of anomaly detection method to use is “how many variables should we consider?” If we only need to look at one variable, we’ll use a univariate approach.
Let’s make it simple and talk about the weather. If we want to look at anomalous weather patterns, univariate anomaly detection will measure a single indicator, such as temperature. We can then ask questions like “is this temperature strange for this region?”
On the other hand, if we need to consider multiple factors and the interplay among them, we’ll select multivariate analysis. A multivariate analysis considers a host of factors, like precipitation, humidity, air pressure, or even tangentially related variables such as crop yield or wildlife activity. As a result, multivariate anomaly detection has a higher ceiling for revealing interesting patterns, but it’s also more difficult to successfully correlate all variables.
Univariate vs Multivariate Time Series Analysis
Our second question brings the third and fourth types of anomaly detection. It’s a simple one: are we going to look at how things change over time? Data scientists call this a time series, and we can perform both univariate and multivariate time series analysis. This approach lets us look at trends, such as increased user engagement with our IoT device, and it also enables us to contextualize our data because it’s reasonable to expect different results at different times.
Going back to the weather, a univariate time series analysis can detect anomalies such as a drop in temperature overnight. Another example is contextual anomaly detection, such as the average temperature during a given month. If we’re looking at the temperature in July, we’ll gather our sensor data throughout the month and then compare it to historical records.
Of course, in the Northern Hemisphere, we expect the average temperature to be higher during July than in December, so this analysis lets us distinguish between these two time periods to establish a normal range for each, thus providing us with a useful context.
Multivariate time series analysis, on the other hand, lets us look at systems as a whole. Let’s take, for example, the record-breaking 2020 wildfire season in the American West. A univariate time series will tell us that yes, indeed, the intensity of this year’s wildfires is anomalous, but a multivariate time series can give us clues about why. These factors include low precipitation, high heat, frequency of lightning storms, or even less obvious contributors such as an increased rate of fires started by more people escaping to the woods because of COVID-19.
A multivariate time series has the potential to uncover relationships that would be otherwise invisible, however, figuring out the relevancy of any given pattern remains a challenge. We cannot forget that correlation does not imply causation. This caveat brings us to our next important question: how do we sort through our algorithms’ results? How do we know that a data point is truly anomalous and actually unexpected rather than a statistical improbability that’s guaranteed to surface eventually?
After all, the odds of getting a royal straight flush in poker are 649,740 to 1, or 0.00015%, but that doesn’t mean that we’d call the winner a cheater, rather than lucky.
Analytical Framing
Answering these questions is the work of a data scientist. We build data models that correlate information. Once we know that a certain range of values is normal, then we can categorize anything outside of them as anomalous, regardless of the context or frequency in which those anomalies occur. For instance, if we’re building a smart toaster, we’ll know an acceptable range of temperatures, voltage, toast durations, etc. We then hardcode these values into our algorithm.
And this is just the beginning. Data scientists need to think critically about many questions, such as:
- Who is this algorithm for?
- Where does this information end up getting surfaced?
- What are the implications of this anomaly?
The process that we take to answer these tough questions is beyond the scope of this article, but the point I want to highlight is that anomaly detection isn’t just plug-and-play artificial intelligence.
Implementing Anomaly Detection In Your Business
As you can see, anomaly detection requires careful consideration, deep subject matter expertise, and collaboration among engineers, businesspeople, and data scientists. Not surprisingly, businesses often need help navigating the complexities of incorporating it into their product or operations.


